Introduction
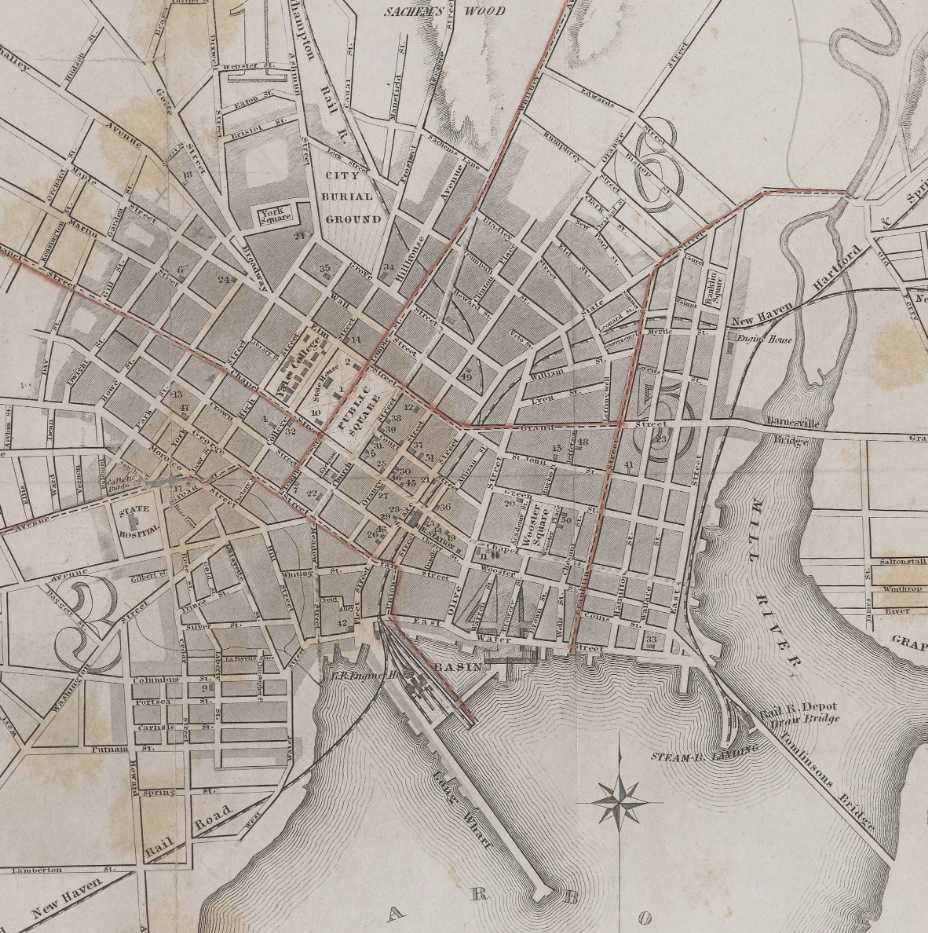
For this project, I went looking through the Allmaps catalogue of map libraries and found a map I was interested in georectifying. In the digital collections of the Yale University Library, I found this survey map of New Haven, New York, which was published by R. Rutherford in 1852. Using a variety of software, I was able to georectify and add layers to the older map to illustrate how both the area of New Haven’s land and its roads have changed over the centuries. This site and the embedded, interactive map exist to convey the process of creating and understanding this new map.
Sources
I began my search in the AllMaps editor, which grants access to a variety of different map collections. After some exploration, I went through the Yale University Library catalogue of maps and found one that piqued my interest: ‘Map of the city of New Haven : from surveys / by R. Whiteford.’ From its description: this survey map from 1852 depicts New Haven’s various banks, schools, churches, hotels, and other public buildings. The shape of the map and layout of the city caught my eye, so I decided to look at it more closely. I accessed the map directly through Allmaps and went through the process of georeferencing in Allmaps Editor. I chose ten total georeference points yet not everything between the older and modern maps matched up exactly. I tried fixing this by applying a Helmert transformation; though it mended a lot of the glaring inconsistencies, some mismatched locations still existed. Since many of the street names in New Haven have been retained from over a century ago, I assumed that I did not georeference accurately enough. At the same time, the better alignment of some streets over others may also convey inconsistencies with Wutherford’s map or a larger change to the city over time. I have tried to account for the most glaring deviations from the old map in the next steps.
Processes
In my time using Allmaps, I played around with the opacity of the 1852 map when I found the georeferencing satisfactory. When looking between the two maps I found that, beyond the general unaligned streets that come with the georeferencing process, certain streets from the old map have either changed or disappeared and new streets have sprung up at some point between the publishing of the 1852 map and today. After importing the georeferenced map into ArcGIS, I continued to notice differences between the two maps after playing more with the opacity.
The most notable differences between the maps would be the expansion of the shoreline, the development of ‘new roads,’ and the disappearance or change of ‘old roads.’ To demarcate these changes, I created a new layer in ArcGIS which allowed me to create polygons and lines based off of these three major changes. I then continued to change the opacity of the older map to locate and outline the areas of the greatest change.
This is the interactive map I managed to create. The downtown area of New Haven is not detailed with lines noting old and new roads as the unalignment has made it quite difficult to judge what is new or old. This said, there are still notable road changes on the borders of downtown. All of the polygons and lines I created were made to give a better understanding of how New Haven has developed. Though there are plenty of more ways to geographically understand New Haven’s development since 1852, I believe that the expansion of land along the coast demonstrates the greatest amount of change in a simple visual format.
Presentation
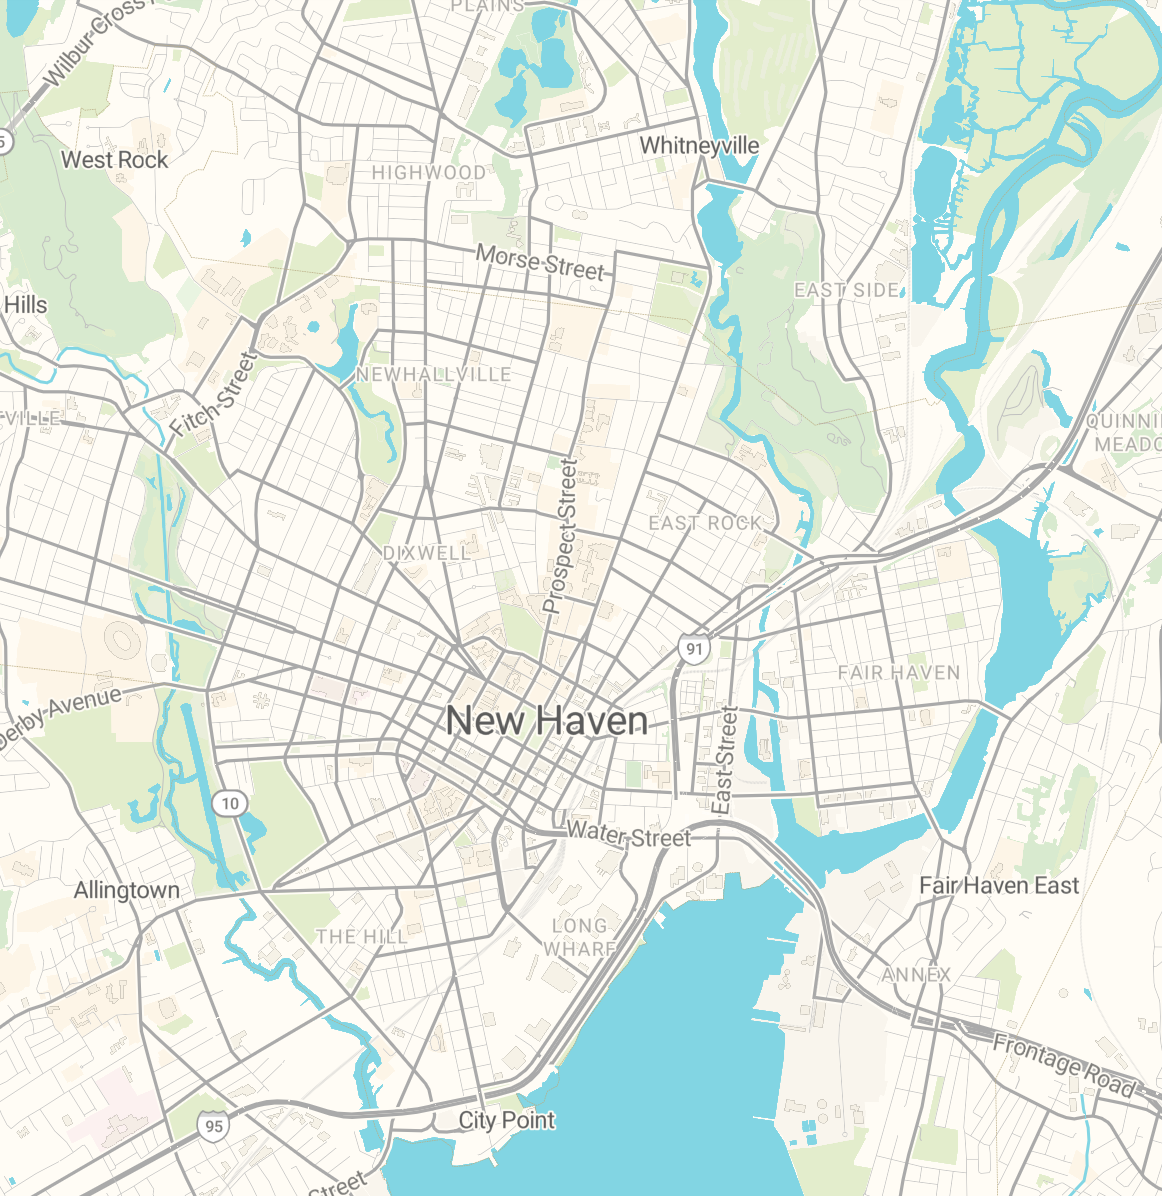
I turned up the opacity on all of the layers of the new map — the 1852 map, the new and old roads, and the areas of land expansion into the water — in order to make the whole more visually appealing. By turning up the opacity, the modern ArcGIS map is able to just barely be seen through the old map layer; this allows the viewer to understand the minute differences between each map when zoomed in to a certain extent. Beyond this, as I have designated the range at which the 1852 layer appears, if a viewer zooms far in or out the old map disappears; this feature allows a viewer to understand how well the 1852 map aligns and matches with the modern one in different areas. The orange lines represent roads mapped on the 1852 New Haven that have since been changed or removed in the modern map. The green lines, meanwhile, represent roads that have been added since the 1852 map was published. I have added a legend and title for viewers to better understand the different aspects of my map. Though I believe this site does not require much in the ways of flashiness or aesthetic, I added a smaller version of the 1852 map (due to size limitations) and a Google Map’s version of New Haven to illustrate some of the differences side by side.
Significance
If we are able to visually compare the differences between old and newer structures or areas of a city, then we may get a better impression of how much said city has grown over the years. My georectified and detailed interpretation of Wutherford’s map shows how much New Haven has expanded into the waters of the harbor. What used to be open water is now home to railways, industries, and housing. Beyond this, some of the roads that once made up the outskirts of the city have apparently been removed to make space for a public park and school. Though these visual depictions do not give us much quantitative information about how much New Haven has grown, the process of creating and sharing this map digitally illustrates this change to wider audience than physical comparisons could. With respect to digital arts and humanities, this georectified map provides another, more visual take on how New Haven has changed since Wutherford’s survey map. One way to expand on the map that I have made would be to find data (through city archives or other sources) on what roads have been added or destroyed and how much landmass has been added since 1852.